 For the past 20 years, academic and popular business journals have been piecing together the core components that some believe will constitute a winning business strategy. Executives are constantly bombarded by news articles or podcasts on business economics illustrating ways to achieve competitive advantage through cost reduction, driving profitable sales, or changing the human capital mix to optimize customer engagement. The hope is these new strategies and business model modifications, aided by finely tuned analytics, will achieve sustainable earnings and market share growth. However, what if one of the greatest potential competitive opportunities has largely gone unnoticed and unappreciated?
The hidden-in-plain-sight opportunity is in recognizing workplace safety performance as a leading indicator of economic and operational performance. In effect, as safety goes, so does the rest of your organization. Moreover, workplace safety, when combined with proactive workplace health initiatives, creates a productivity multiplier effect that serves to support all other corporate key performance indicators. Paying attention to workplace safety is inexpensive, clearly measurable and, when correctly applied, moves the strategy-impact needle like no other key metric.
Embracing safety as a strategic process may not be the first thing that comes to mind. Indeed, recently published business surveys show today’s management knows how to plan and allocate costs for potential future strategic risks such as reputational, cyber attack, and business interruption. The problem is all that planning tends to ignore real losses due to employee injuries and customer liability and to recognize these losses constitute an immediate and ongoing financial drain on the organization. Unfortunately, safety departments have focused on the tasks that resemble compliance but have overlooked the human behaviors that contribute to loss. Safety is about behaviors, not tasks.
New research and operational testing in the manufacturing and retail industries has revealed that safety impacts an organization by driving cost reduction, fostering a culture of risk understanding/mitigation, and directly affecting employee morale and productivity, all of which translate to enhanced operational and financial performance. Today, new concepts of behavioral safety may be to sustainable profits as Six Sigma has been to operational efficiency and lean economics. The early performance results are very encouraging.
Why is this the case? Typically in most companies, discussions on safety are relegated to regulatory compliance. Traditional risk/safety teams are seen as audit-based, regulatory-focused inspectors saddled with the responsibility for safety. Should an Occupational Health & Safety or other agency regulator come knocking, there is plenty of employee-signed documentation to prove the company is doing what it should.
The problem is that an exclusively regulatory focus rarely prevents workplace injuries. The approach just keeps the regulatory agencies out of your yard. Think about it: What do you have to sell to make up for a $30,000 back injury claim? Moreover, what opportunities to execute strategy have you forfeited by not having your workforce healthy, productive and at work? The evidence shows us that for every dollar spent on an injury, no matter if it is time off or medical recovery, you spend an additional three dollars in indirect expenses. These indirect costs can include recruiting and training a replacement, the loss of sales or customer engagement as individuals approach their profitability yield, and the cost of overtime. Moreover, do not forget the potential risk to your organization by temporarily overworking your remaining workforce.
For progressive companies, the responsibility for safety is embedded in operations. Economic incentives have been carefully developed to reward the behaviors that promote workplace safety, and the responsibility and accountability for safety behavior implementation belongs to operations. Safety is an “operational pivot,” that touches and impacts every part of the organization where human behaviors exist. Thinking in this fashion, prevention quickly becomes a high-value strategic KPI.
Understanding the economic value of prevention as it relates to EBITDA, ROI, EPS and shareholder confidence in management becomes the new standard. Big data, better-focused analytics and use of systems control techniques can now show us where the improvements are and how they “move the performance needle.”
Today’s new risk and safety personnel are shedding their auditor roles and becoming partners with operations—the correct owners of safety—to drive risk-informed decisions. Research and experience is showing us that better performing companies are identifying the behaviors that lead to accidents or damages. They then support operations to recognize and reduce both the direct and indirect costs of risk issues.
For example, one large nationally based grocery retailer implemented a focused behavioral safety and risk management approach and installed the tools to drive a culture change. This company embraced the notion that everything a human worker touches generates both good and bad operating behaviors. They posted transparent information and standardized the analytics on safety performance by division, district and down to the store level; employee safety education was transformed from regulatory-focused to behavior-focused and called out the behaviors that contributed to loss. By doing this, the company not only brought down their workers compensation frequency rate to the lowest in its industry—resulting in more than $100 million in hard savings—but multiplied the savings via increased sales, reduced shrink and significantly improved its customer and employee engagement. The key tool used to determine the impact was systems control charting.
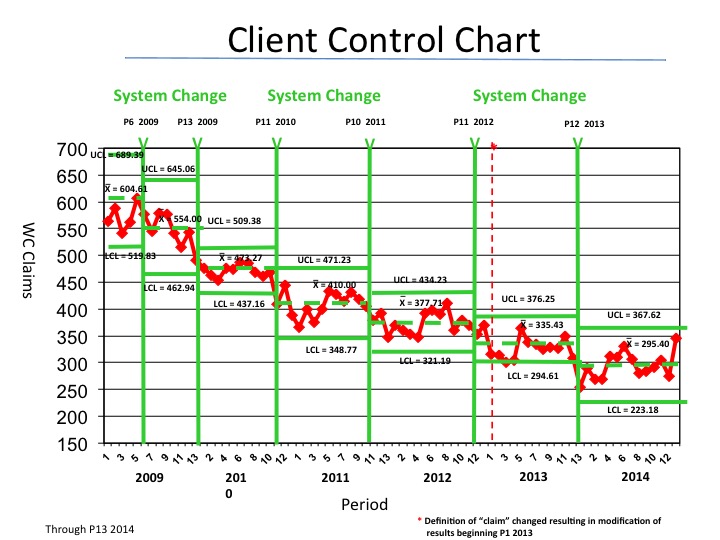
Systems control charting is a statistical tool that views whatever you measure as a system, where identified inputs produce specific outputs in a controlled environment. In this case, the output is workers compensation claims. The chart shows upper control limits, the mean value per period and lower control limits. The upper and lower control limits are the statistically designated space that employee injuries will “normally” operate without undue external stimulation. The mean value represents the average claims value for a particular period. Systems control charts are an objective way to see if your safety team’s (in truth, your operations team’s) efforts to control frequency had an impact or created a sustainable change. In this case, there were positive and negative systems changes where claims performance was fundamentally altered as a result of some stimulus.
The important thing about using systems control charting is it tells you whether your safety programs—or other risk management programs for that matter—are “effective” enough to impact a systems change. In this example, while the calculations are not shown, a 100-basis point change in frequency rate equated to $15 million in cost. More importantly, we now know workplace safety generates a multiplier effect that can either accelerate economic growth and performance, or signal short-term profits reduction and operational failures.